Back from Graphs
Welcome Back
Finished playing Graphs?
Here's what people are playing next:
- New game by the creator of Wordle
 Parseword Word game • Popular today
 -
 Glyph Word game • Popular today
 -
 Chronoodle Trivia & knowledge • Popular today
 -
 Connections Word game • Popular today
Graphs
by graphs.world
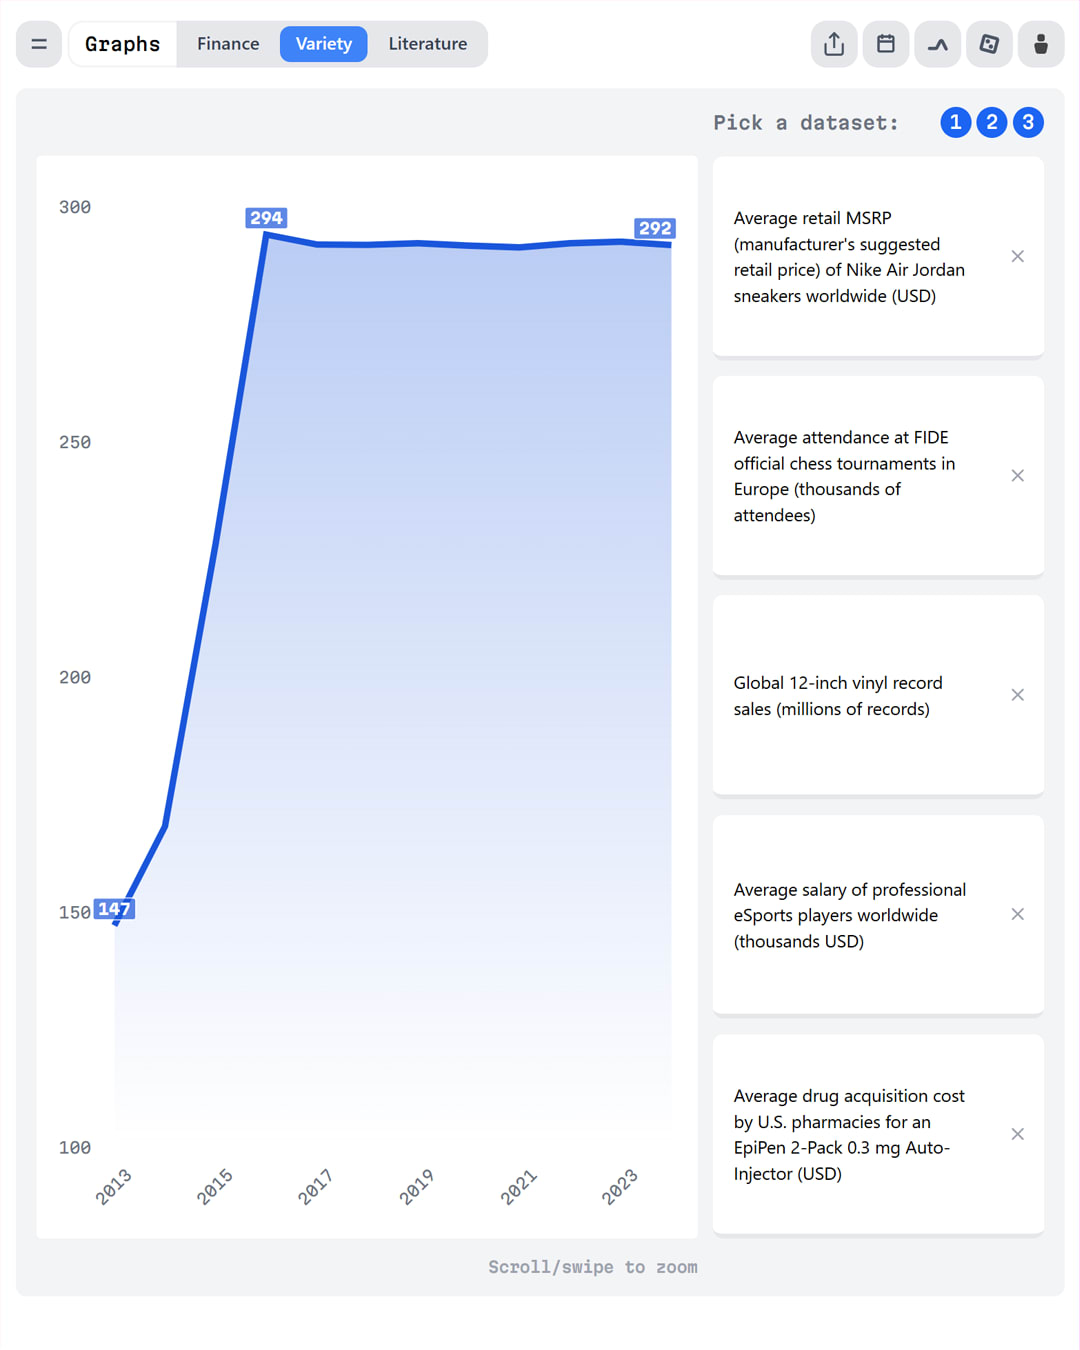
Choose the dataset that matches the shown graph.
 Screenshot
 Objective
Identify which dataset matches the displayed trend line from a list of real-world options.
Playlin'sGuide
Graphs is a daily data-interpretation game where you’re shown a real line chart and asked to figure out which dataset it represents. Each puzzle blends pattern recognition, logic, and a bit of real-world knowledge.
How it works:
- A single line graph appears, showing a dataset over time.
- On the right, you’ll see several possible dataset labels (e.g., fitness memberships, library visits, military deployment numbers).
- Study the growth, declines, spikes, and plateaus in the chart.
- Choose the dataset that best matches the shape and trend.
Every graph is based on real data, making the answer both logical and educational.
Why we like it:
- ✅A smart, satisfying blend of deduction and real-world facts.
- ✅Quick to play yet surprisingly challenging.
- ✅Makes you feel like a data analyst in under a minute.
Hint: Look for signature trend behaviors like teady climbs, sudden drops, or long flat periods often reveal the category.
About the Game
Creator: graphs.world
Category: Logic & Deduction
Updated daily: ✅
Love this game?